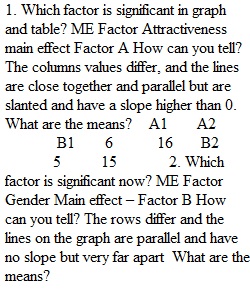


Q Name:_____________________ Lab 11: Two-Way ANOVA Psych248 Hunter College The goal of the two-factor ANOVA is to evaluate the mean differences that may be produced by two factors acting independently or by two factors acting together. The mean differences among the levels of one factor are referred to as the main effect of that factor. An Interaction occurs whenever the two factors combine to jointly influence the dependent variable in a way different from what would be predicted from the main effects. PART 1: Recognizing Main Effects and Interactions. Please follow along during the Demonstration led by your instructor and fill in means and your written answers. 1. Which factor is significant in graph and table? ME Factor ______ How can you tell? __________________________________________ What are the means? A1 A2 B1 ____ ____ B2 ____ ____ 2. Which factor is significant now? ME Factor __________ How can you tell? __________________________________________ What are the means? A1 A2 B1 ____ ____ B2 ____ ____ 3. What is significant now? ME? Interaction? ________________ How can you tell? __________________________________________ What are the means? A1 A2 B1 ____ ____ B2 ____ ____ 4. Create a pattern with two significant main effects and no interaction – Factor A and Factor B. What does the graph look like? Describe in words:___________________________________ add means: A1 A2 B1 ____ ____ B2 ____ ____ 5. Create an interaction effect with NO main effects -a Crossover Interaction. What does the graph look like? Describe in words:___________________________________ What are the means? A1 A2 B1 ____ ____ B2 ____ ____ Please listen and watch while we go over how to organize data entry and how to run this ANOVA in JASP. After the overview you will run two ANOVAs, copy results into this doc, and write the results in APA format PART 2: A Social Psychology Example - Using JASP to analyze a study using two-way ANOVA. Open the data file called Dating.csv in JASP. Notice the scale var is the DV – time. It is amount of time in minutes that each female participant spent talking to a guy they had just met. The ‘guys’ were part of the study and varied in attractiveness and in the type of conversation starter they used when addressing the female participant. We want to know what factors influence how many minutes women spend talking to a guy they just met. 5. What are the names of the two Factors (IVs) in the file? _____________ and __________________ Add value labels: attract (1:attractive 2:unattractive) and approach (1:conversation 2:humor 3:pickup-line). Fill in the names of the levels for each Factor in this 2x3 design (along top row and left column). Type of Pick-up Line used: Attractiveness of ‘the Guy’” B1 B2 B3 A1 A2 RUN it. In JASP, select ANOVA > Classical > ANOVA. Time is DV. Use attract and approach as Fixed Factors. Under Options choose Descriptive statistics. Under Descriptive Plots: attract for Horizontal, approach -Separate Lines 6. What is the F for Factor A Attractiveness? ________________________ Put a * by those that are significant. and F for Factor B Approach? ________________________ and F for the interaction effect? _______________________ 7. Conclusion: Based on the descriptives, F-tests and the Plot, write a few sentences in APA style to describe these results. Include which effects are significant and describe the findings in terms of this study (IVs and DV). The full pattern is seen in the significant interaction–that’s the primary finding because main effects are qualified by the interaction. 8. Copy the ANOVA Summary Table, Descriptives table and Plot into this worksheet here after your conclusion. ? __________________________________________________________________________________________________ Part III – A Clinical Example Use JASP for Two-Factor between-groups ANOVA & write conclusions. We want to run a study to see if different behavioral therapies (1:Psychodynamic, 2:Cognitive Behavioral, 3:Exposure and Response Prevention) and different medications (0:Placebo, 1:SSRI, 2:Zinc Supplement) work differently in promoting weight change among patients with anorexia. By running a two-way ANOVA, we can see how the different therapies and medications affect weight change both separately and together (i.e. their interaction). With JASP open the JASP data file called Anorexia Study. Write out the three alternative hypotheses in words. 1. 2. 3. 4. Look at the Medication variable. How many levels does it have? _______ 5. Look at the Therapy variable. How many levels does it have? _______ 6. How many different groups would there be in this ANOVA analysis? ______ In JASP, select ANOVA > Classical > ANOVA. Transfer the WeightChange variable to the Dependent Variable box and both the Therapy_Type and Medication variables to the Fixed Factors box. Make sure to select Descriptive Statistics under Display. Under Assumptions Check, select Homogeneity tests. 7. Record the Levene’s Test F ___ and p-value ___. Is the Levene Test of Equal Variances significant? ___ Can we assume homogeneity? 8.Under Descriptives Plots: Put Therapy_Type under Horizontal Axis and Medication Under Separate Lines. Click Display Error Bars and choose Standard Error. Looking at this Figure, which medication seems to have had the greatest effect? Does it look like an interaction between therapy type and medication? ______ How can you tell? 9. ANOVA Results: Copy the JASP ANOVA summary table in here 10. Run the post-hoc test on the factor(s) or interaction term that is significant. Which level of the significant factor showed the greatest effect on weight? 11. Please report the results of these ANOVA analyses in a few APA style sentences that include the significance of each test, with APA statistics for the significant ones, and summarize the post-hoc test results. 12. Copy from JASP the rest of your ANOVA results: Descriptives Table, Plot, Homogeneity test & Post Hoc test into this worksheet after your conclusion. It may be helpful to have examples of all of the ANOVA results.
View Related Questions